I was looking around for some data and analysis regarding the Roman Empire and Roman Emperors. This can be hard to find at times given the fact that data from that period is not overly reliable. Records can be lost, destroyed or not collected correctly. This is typically a problem when analyzing the scant data we do find in most ancient civilizations.
Pieces of data that we do have, analysis is usually done but a lot of times it lacks a visual representation of the data that is being analyzed. So, I decided to compile some data and analyze it.
I often hear of the periods of stability within the Roman Empire (most notably, the Pax Romana), while we are quite often told about the crisis of the third century. I wanted to have a look at these periods and see what the data bore out and whether we can base ‘stability’ solely on the number of years an Emperor has been in power for.
The charts below represent all Emperors, from Augustus to Romulus Augustulus. This includes sole emperors and emperors who ruled jointly with emperors from the east or in the tetrarchy. As you can see, the emperors are named along the bottom, and the years that they reigned are along the vertical axis.
For the amount of time that an Emperor has been in power for, I round to the nearest year. So, if someone reigned for 13 years and 6 months, I rounded it up to 14 years. If they reigned for 13 years and 5 months, I would round it down to 13 years. In the cases where Emperors reigned for less than 6 months, I rounded to 0. The purpose of these charts is to look at patterns, not to depict on a chart the amount of time (narrowed to days or months) an Emperor was in power.
It must also be noted that some Emperors reigned during the turn of a new century. In these instances, I have separated their reign over two graphs to depict their time in charge in each century. So, Trajan features in two charts as he reigned for two years in the first century AD and the rest of his reign in the second century.
The first chart represents the reigns of the Roman Emperors, from its first Emperor, Augustus, until its last Emperor, Romulus Augustulus. I am aware of the conjecture surrounding who was the last western Emperor, Romulus or Julius Nepos (476 or 480). This is an entirely different subject altogether. For the purposes of this analysis, I have placed Romulus in the spot of the last Emperor, but I have included the total number of years that Julius Nepos was recognized as the leader of the Western Empire.
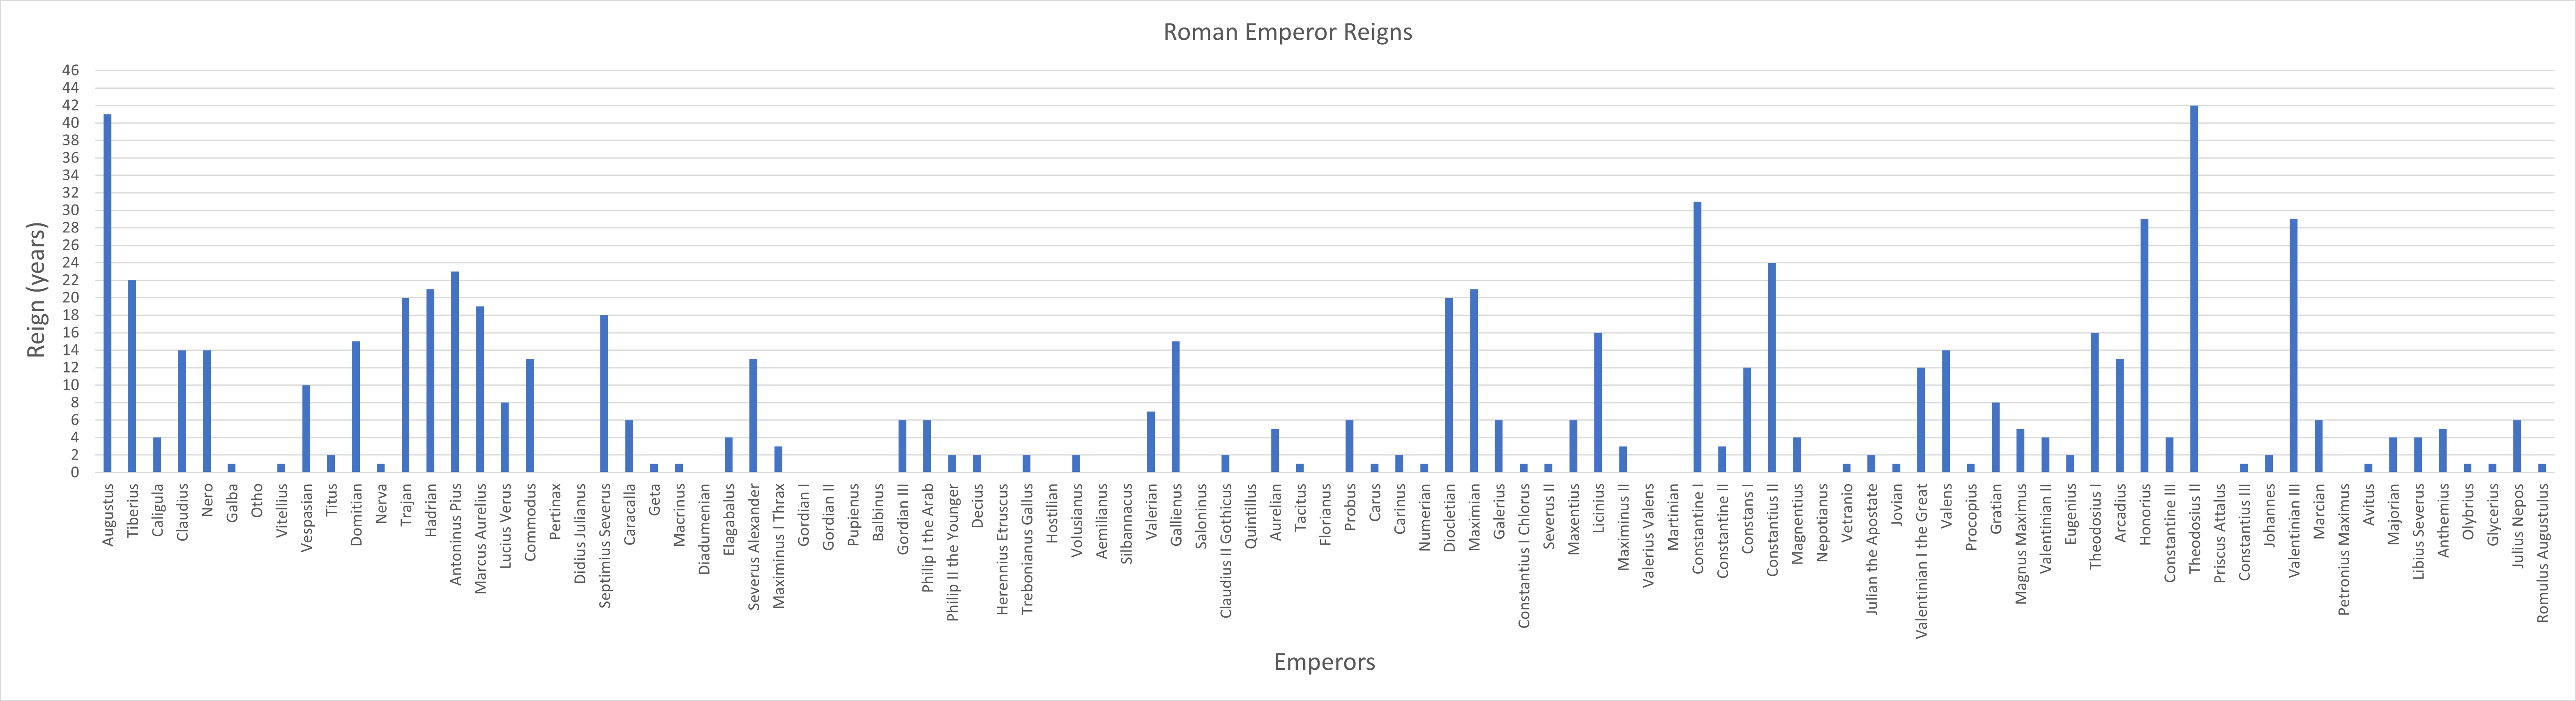
As you can see in the chart, there is a large cluster of Emperors that reigned for significant amounts of time between the time of Augustus and Commodus (27 B.C – AD 192). The main exception to this is the “year of the four Emperors” in AD 69. This was the year after the death of Nero and a period of instability, which saw Galba, Otho and Vitellius all come and go in quick succession, with the imperial robes eventually landing at the feet of the builder of the Colosseum, Vespasian.
It must be noted that not all reigns are created equal. We see that Commodus reigned for 13 years, but it could not be said that his reign was better than that of Titus, Aurelian or Majorian just because he reigned for longer.
The period between Commodus and Diocletian (AD 192 – AD 284) saw a period of instability and upheaval. This period also became known as the “crisis of the third century” where Emperors were regularly deposed for usurpers, or they were assassinated.
We see stability return under Diocletian in late AD 284, although his reign was not without its problems. The fourth century saw the rise of Constantine, while there were other Emperors who reigned for a number of years.
The fifth century started with the long reign of Honorius, while the empire’s longest serving Emperor, Theodosius II, also featured in the fifth century. Valentinian III also reigned for almost 30 years.
However, these long reigns cannot necessarily be seen as successful as Honorius oversaw the first sacking of Rome in 800 years. The vast majority of the fifth century was also dominated by multiple sackings of the city, while wave after wave of barbarians flooded the empire’s borders, leading to the loss of land and tax revenue.
The following charts show a breakdown of Emperors during the centuries:
- 27 BC – AD 100
- AD 100 – AD 200
- AD 200 – AD 300
- AD 300 – AD 400
- AD 400 – AD 480
27 BC – AD 100
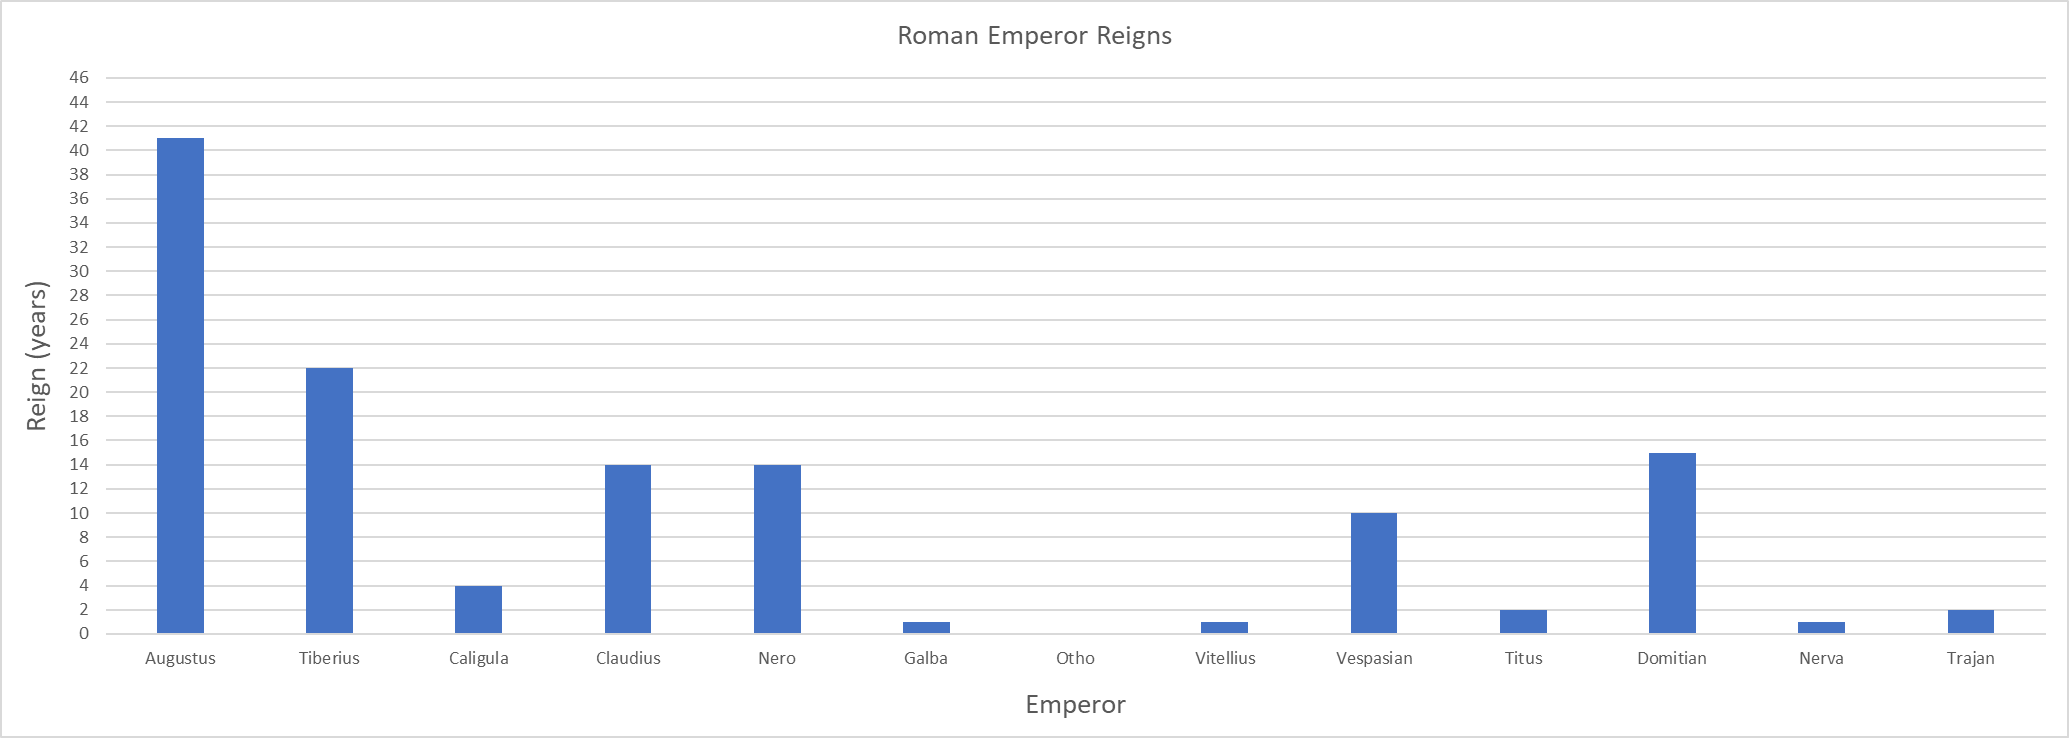
The graph looks somewhat skewed due to the fact that Augustus reigned for so long. Trajan only started his reign in AD 98, so most of his reign shows up in the following chart. This time period saw great expansion of the empire and was highlighted by the building of the Colosseum.
AD 100 – AD 200
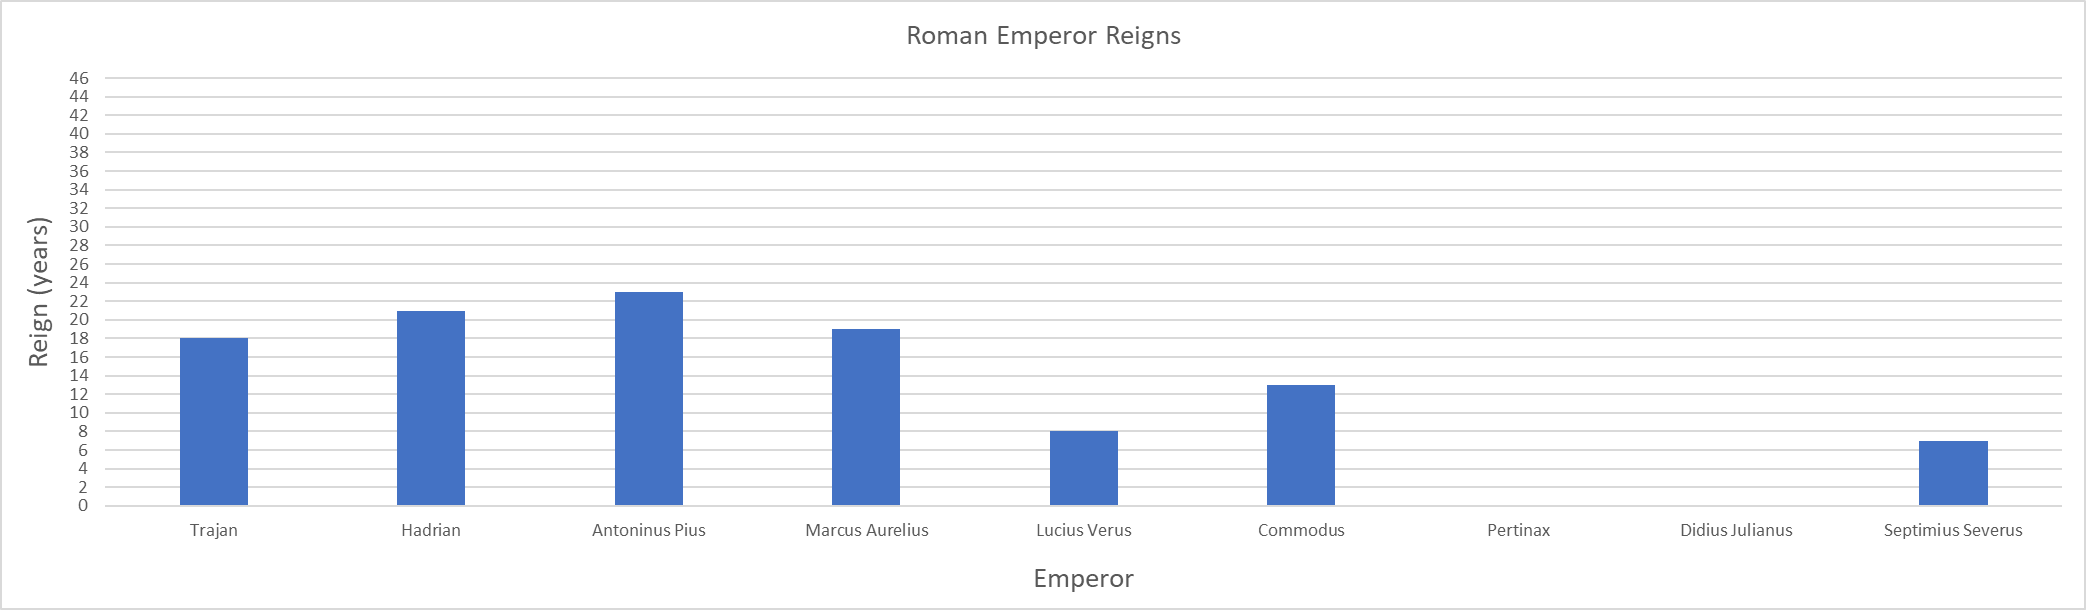
This period saw the Empire reach its zenith, geographically. This was helped by the stability in the empire, reflected in the number of Emperors who ruled during this century – the least number of any of the five time periods. However, things started to wane under Emperor Commodus.
AD 200 – AD 300
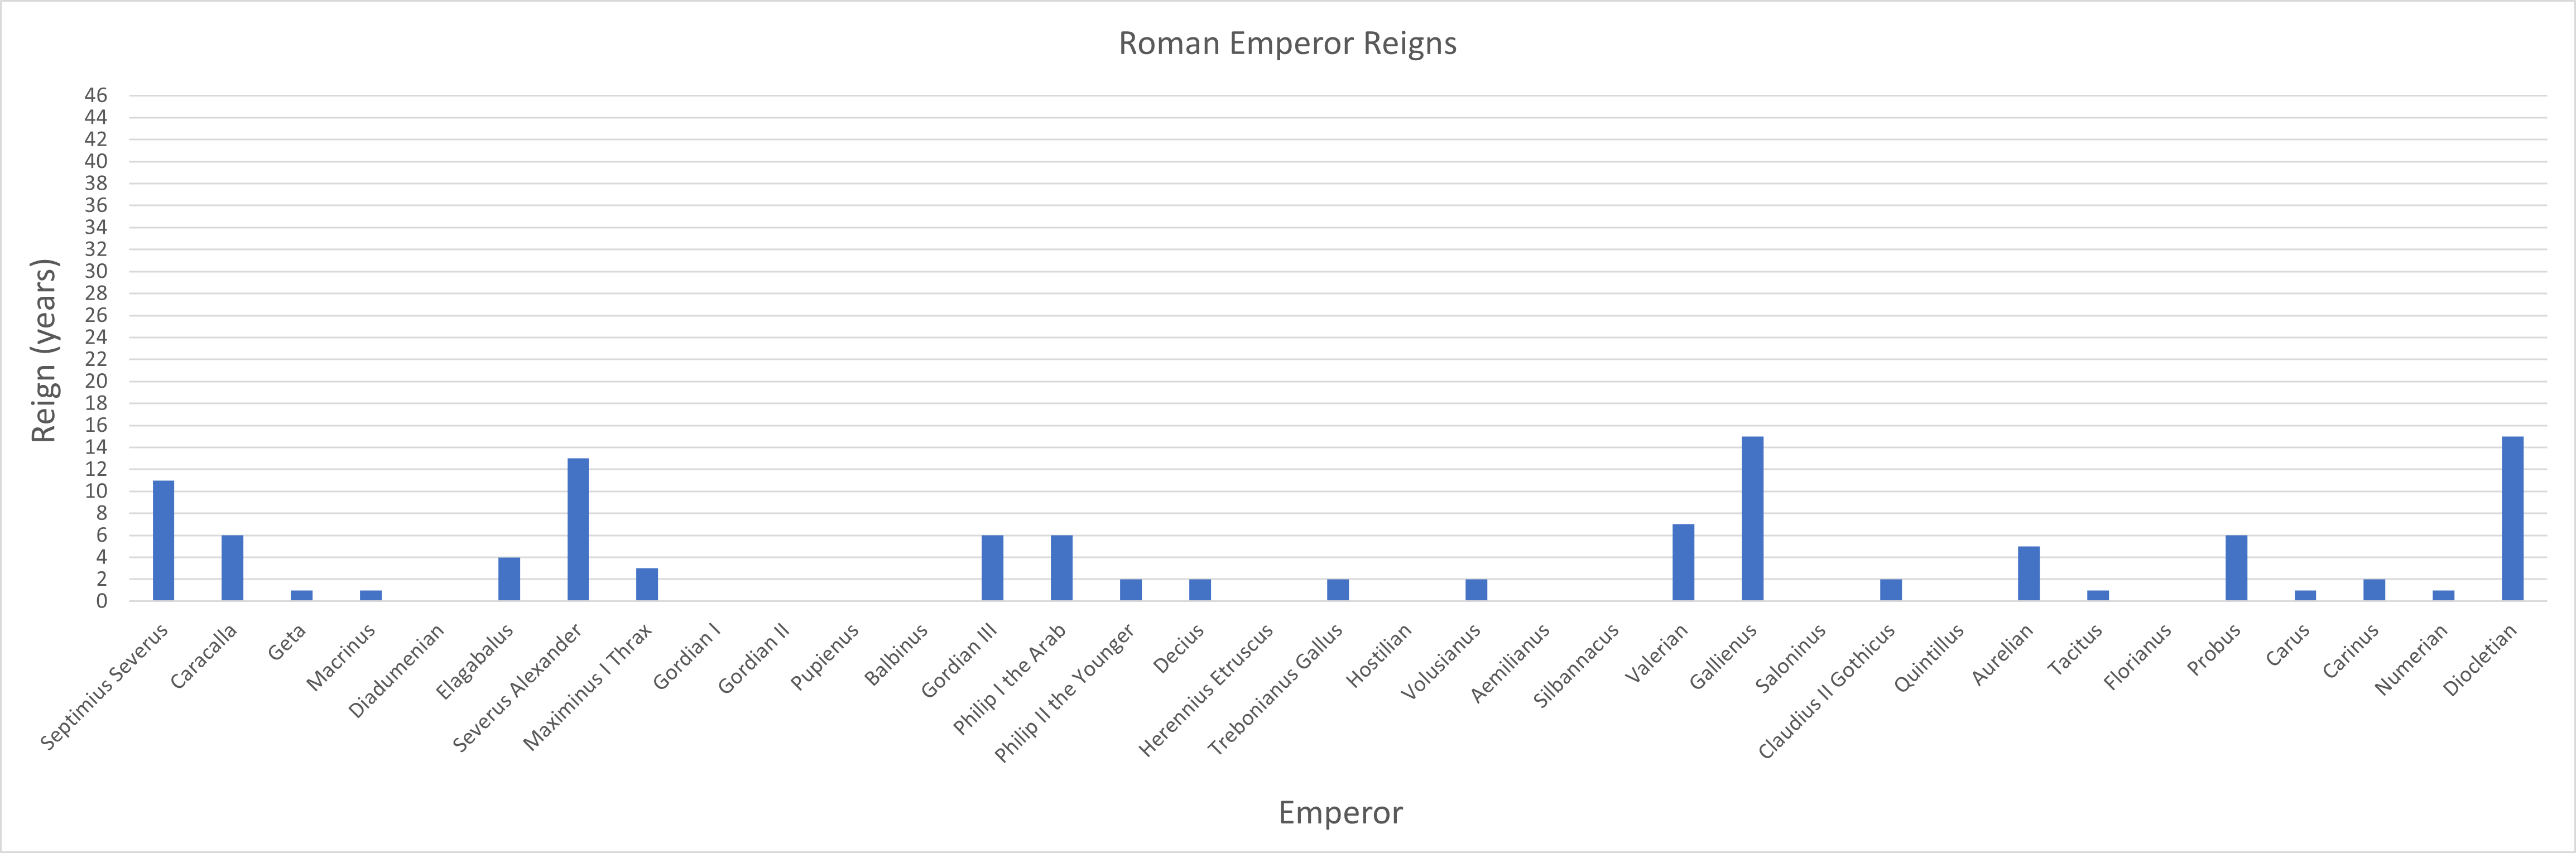
A period of turmoil and instability, also known as the “crisis of the third century”. No less than 35 Emperors ruled during this period, a far cry from the nine that served during the previous century. This period saw a weakening of the Roman military through civil wars and inept leadership. Gallienus ruled for around 15 years, which was rare, while the century ended with a long reign under Diocletian.
AD 300 – AD 400
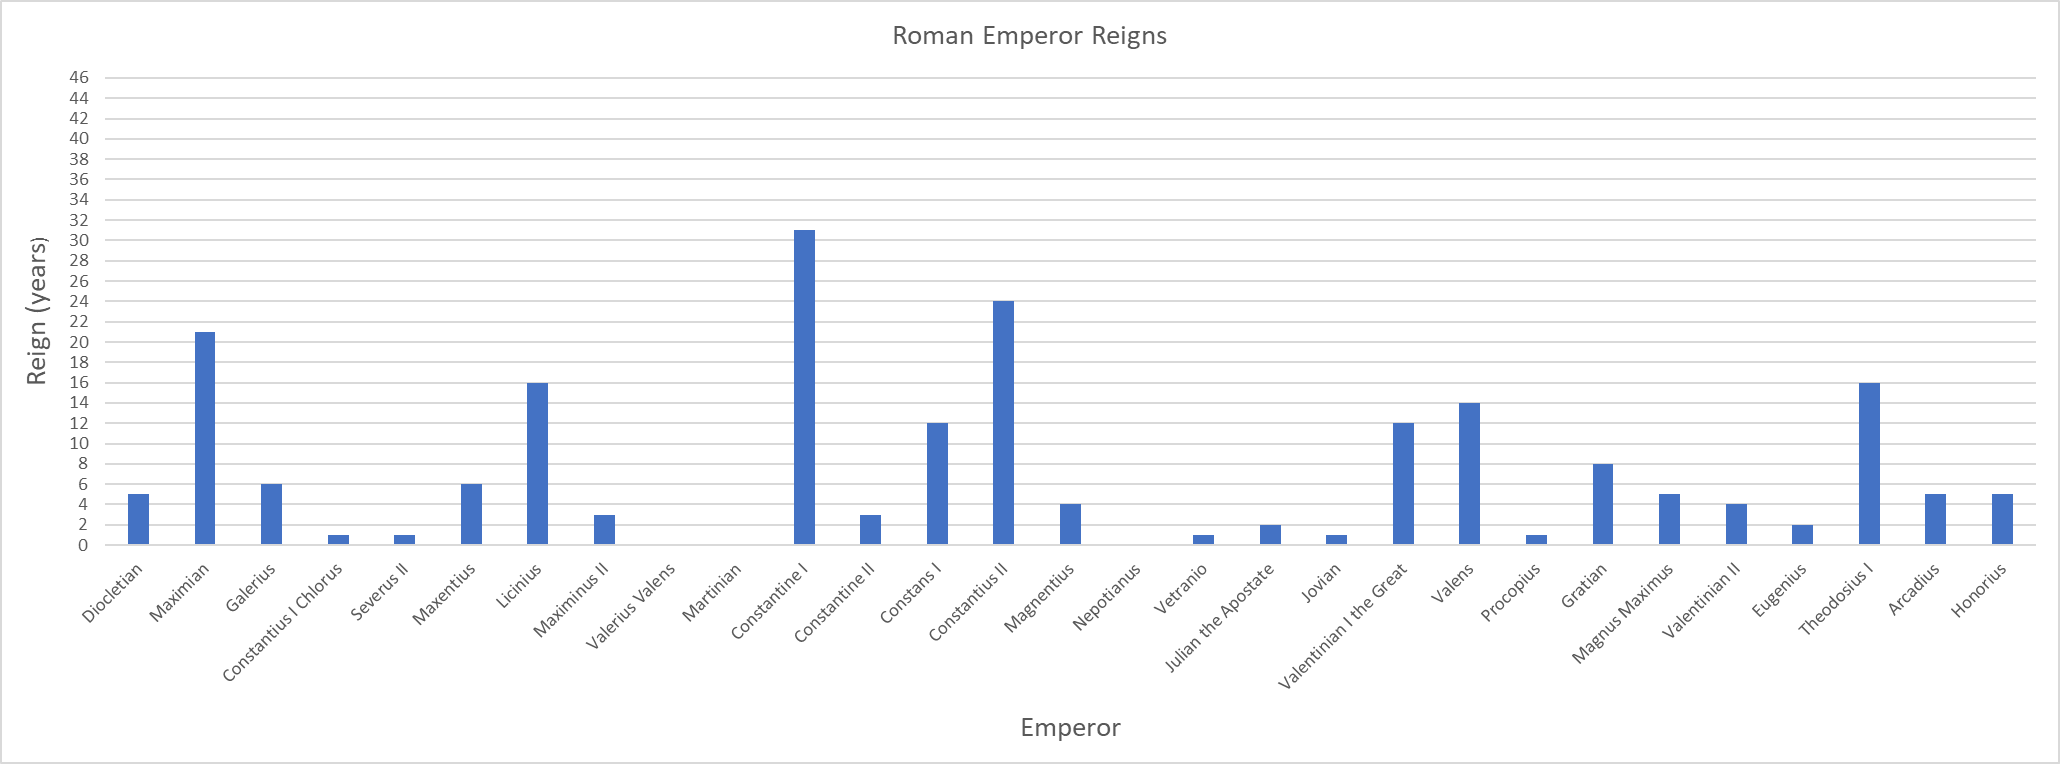
A century that was marred by instability, although slightly better than the previous one. With the final years of Diocletian’s reign ending at the start of the fourth century, the period saw times of long reigns while there were also periods of great instability. The century saw 29 people wear the purple imperial robes. The century ended with the joint rule of young Emperors, Arcadius and Honorius.
AD 400 – AD 480
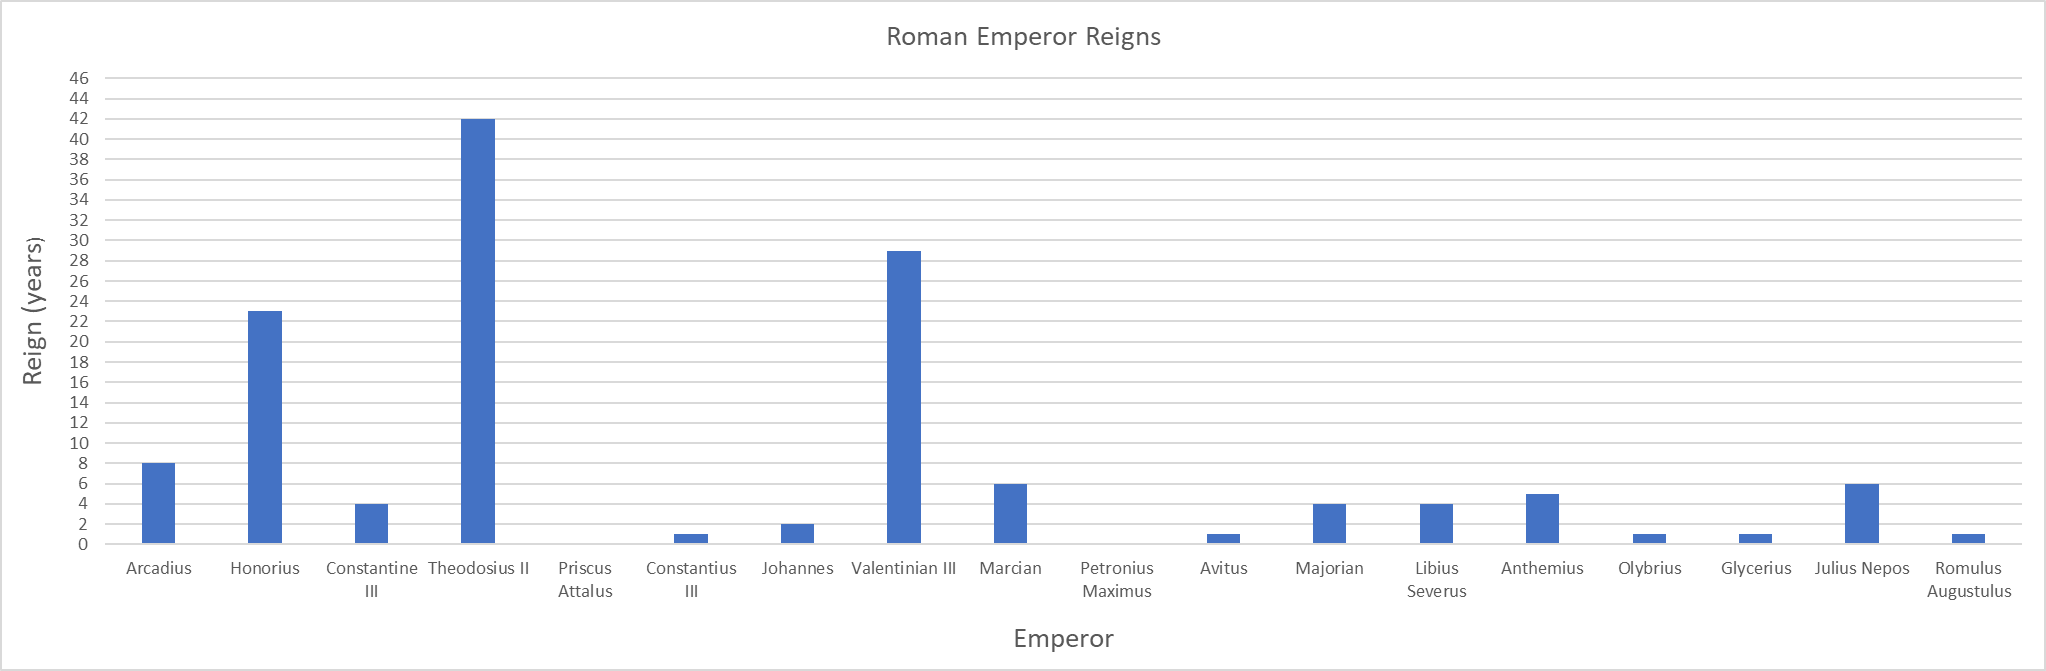
The chart makes it look like the fifth century started off quite well, with little change in imperial leadership. However, the chart does not show how disastrous the fifth century was. Honorius was the man in charge when Rome was sacked for the first time in 800 years, in AD 410 by Alaric and the Goths. His tactical mistakes, indecision and lack of leadership were a disaster for the empire. The empire was already in a weakened state by the time he ascended to Emperor, but he effectively accelerated its downfall. Other Emperors of this time may have reigned for long periods, but it seemed to be a case of managing the decline of the empire. Emperor Majorian appeared to be an effective military commander, but as depicted by the chart, his reign was short-lived. He was brought down due to treachery by his Magister Militum, Ricimer.
Julius Nepos reigned for 6 years but was sent into exile after one. The usurper Romulus Augustulus was placed on the throne, but was deposed in AD 476, thus marking the “official” fall of the (Western) Roman Empire. However, Julius Nepos was still recognized as the Western Roman Emperor by the Eastern Roman Emperor, Zeno. He was recognized in that role until his death in AD 480.
At times it is great to get a visual representation of what we are being told about the reigns of the emperors. Conversely, without detail and context, the data can be interpreted in different ways. This can lead to incorrect assumptions and conclusions.